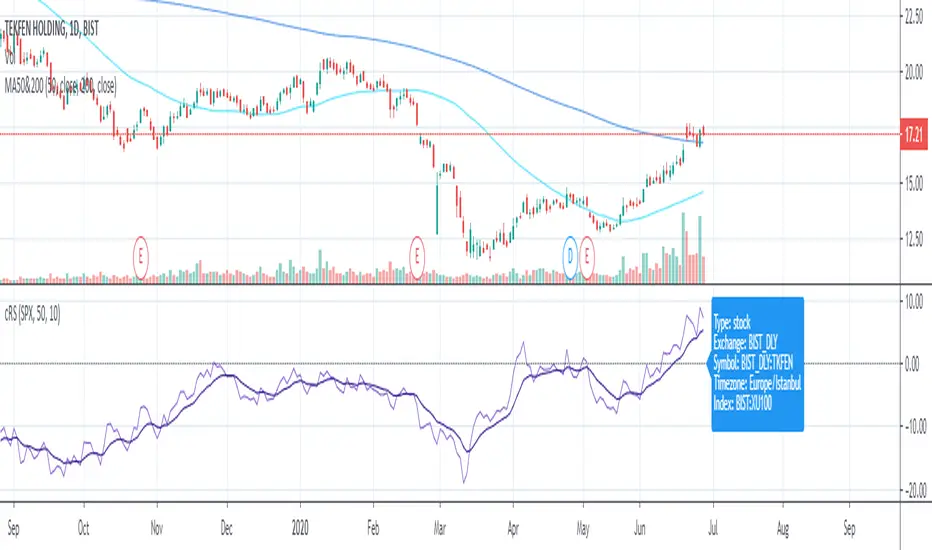
Relative Strength Moving Average CrossoverA popular technical analysis strategy is the moving average crossover. This indicator combines a crossover with the Relative Strength Line, created by William O’Neil. The RS Line is a tool used to compare the price action of a particular stock to that of an index, with the S&P 500 being the index preferred by O'Neil.
When one moving average crosses above or below another, that may be a signal of a trend change. For example, when a shorter-term moving average (aka faster moving average) of price moves up and through a longer-term moving average (aka slower moving average), it is likely the price is trending up, this is referred to as a crossover. The opposite can also be a potential signal of a change in the trend. When a shorter-term moving average crosses under a longer-term moving average, the price may be heading down. We refer to this as a negative crossover or crossunder.
This indicator allows configuration of up to two moving averages for the RS Line. Using two moving averages you can quickly identify the direction of the trend and also pinpoint where the faster moving average crosses over or under the slower moving average.
While beta testing this indicator, we performed a study using Bitcoin. In 2021 we’ve seen an increasing correlation of BTC and the S&P 500. This is most likely due to the fact that both crypto and stocks are riskier than other financial assets such as bonds and commodities. When the market is risk-off, both the S&P 500 and Bitcoin tend to sell off together.
For the BTC test case we used two moving averages of the RS Line, 8-EMA and 50-SMA. In the chart that follows you can see a breakdown of how this played out over the last ~2 years. A positive divergence is indicated by the 8-EMA of RS crossing above the 50-SMA, and vice versa for a negative divergence.
Here's another example using TSLA:
Features
■ Configure up to two moving averages for each timeframe.
■ Optional symbols indicate moving average crossovers.
■ Configure custom alerts on crossovers, for any timeframe.
■ Optional moving average cloud makes it easy to identify if slower moving average is above/below faster moving average.
■ Configurable index, defaulting to S&P 500 (SPX).
Acknowledgement
This project is a collaborative effort with @blakedavis17 a Crypto-Equity Analyst. Based on a discussion with Blake about a moving average crossover using the RS Line, we created a simple indicator to explore the concept further. We were very encouraged with the results of backtesting and decided to publish the indicator as we believe it may be a helpful tool for both equity and crypto traders.
Cari dalam skrip untuk "relative strength"

Relative Strength Improved (Premal Parekh ASR Version)This script is improved over the existing script developed by Mr. modhelius
I have added ASR Concept of Mr. Premal Parekh.
This script will remove manual calculation of Trading Days from ASR Date.

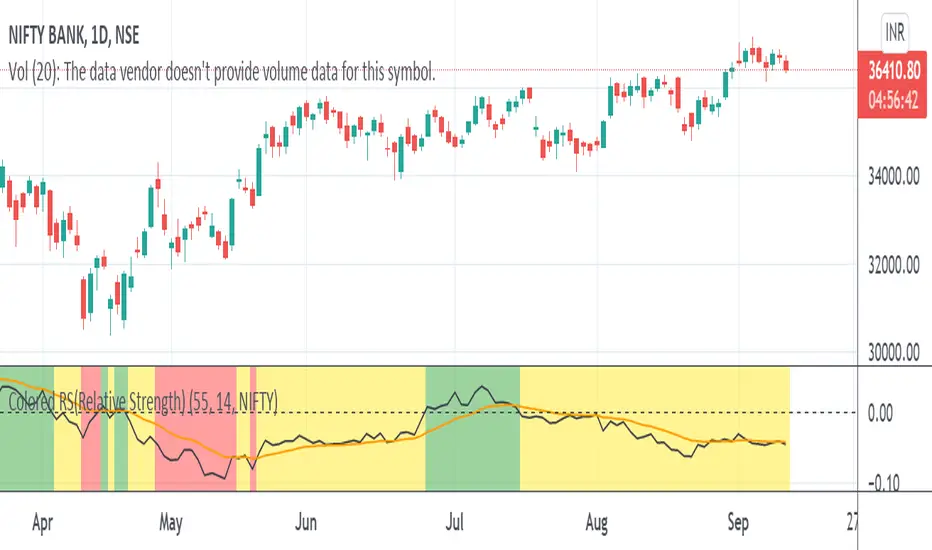
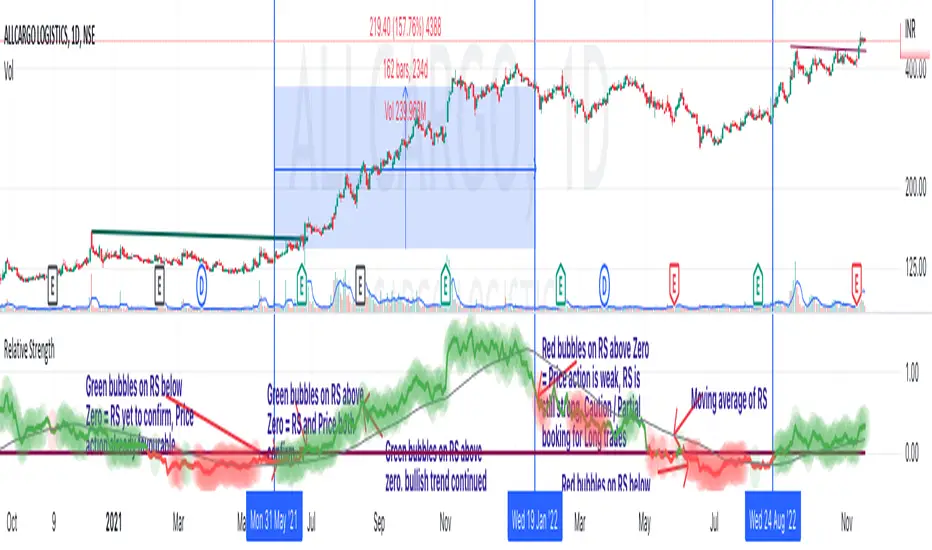
Colored RS(Relative Strength)Relative strength is a calculation of the price trend of a stock or a financial instrument in comparison to another instrument, stock, or industry.
Color indication
Red :: Benchmark returns is -ve and the RS_Value is below 0.
Yellow :: Benchmark returns is +ve and RS_Value is below 0.
Green :: Becnhmark returns is +ve and RS_Value is above 0.
Blue :: Benchmark returns is -ve and RS_Value is above 0.
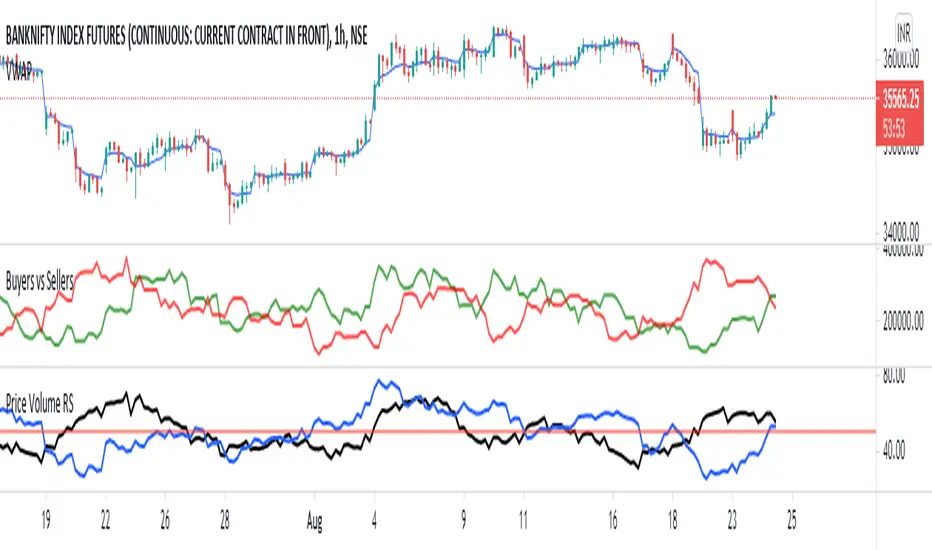
Relative Strength - Price & VolumeNow you can see both Price & Volume Relative Strength Together
If both Price & Volume increases, then BULLISH
If both Price & Volume decreases, then UNCERTAIN, NEUTRAL, TRAP
If Price decreases & Volume increases, then BEARISH
Relative Strength Index 2x maThe relative strength index, represented as two moving averages with periods, one of which will be a multiple of the longer moving average by the amount you set.
The indicator can work both in automatic and manual mode. In automatic mode, the optimal periods are selected, in my opinion, depending on which timeframe is being analyzed at the current moment. In manual mode, you can set the required period yourself.
You can also set the method of smoothing the moving averages yourself and apply them to the opening or closing, the minimum of the bar, etc.
An important point: it is possible to enable/disable graphical functions that may not be required - just check the box next to the function that you want to see on your indicator.
Show ConDiv? - enabling / disabling the convergence/divergence function of the moving averages of the RSI indicator (not to be confused with the MACD for the asset price chart)
Show ma? - enabling/disabling the graphical display of the moving averages of the RSI indicator
Show RSI? - enabling / disabling the standard RSI indicator (if you want to see only it, check the box opposite; in this case, you need to remove the other two checkboxes)
I wish you good luck in building your trading plans, and remember: such indicators do not predict the future price movement on the chart, they only determine the characteristics of the price movement at the current time, taking into account historical data.

Relative Strength ComparisonThis indicator compares the difference in percentage change between two symbols
over a user-specified number of bars.
Default settings will show the difference between the current symbol and the
S&P 500 ETF (SPY) over 10 bars. It can be used to determine if the stock is
showing relative strength or weakness compared to the overall market.

RELATIVE STRENGTHstudy(" RELATIVE STRENGTH", shorttitle="RS")
a = tickerid
b = input("NIFTY",type=symbol)
as = security(a,period,close)
bs = security(b,period,close)
plot(as/bs, title="RS" ,color=blue)

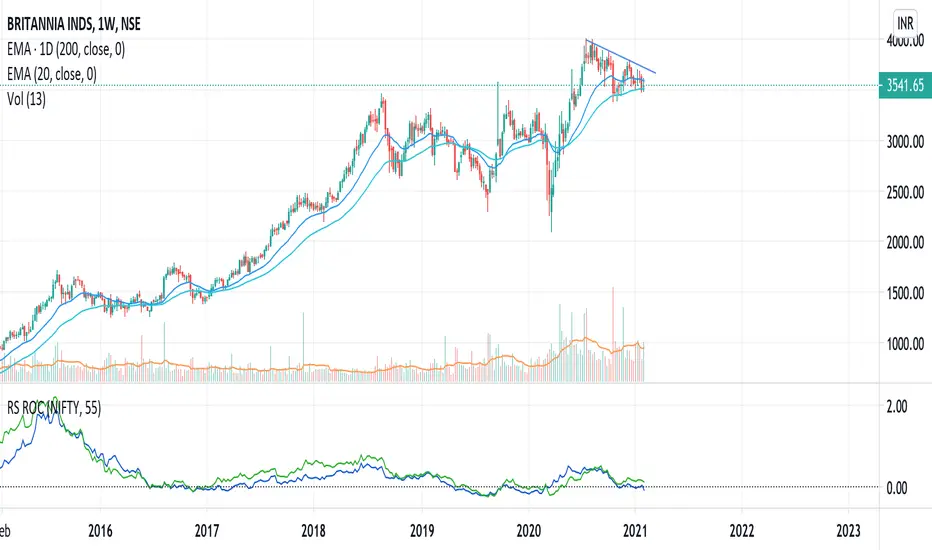
Relative Strength (RS) and Rate of Change (ROC) Combined in oneThis indicator combines Relative Strength and Rate of Change (ROC) in one plot. Change the period and comparative symbol (defaulted to NSE:NIFTY) in settings.
[towT] RS relative strength (ROC)Relative strength RS line based on compositing the stock's "Rate of Change" of 4 different periods.
Default 63 bars = 1 quarter.

Relative Strength : Indian Stocks VS NIFTYIt measures the Relative strength of Indian Stocks vs NIFTY Index


Relative Strength of a stockDetermine the relative strength of a stock vis-a-vis a larger benchmark. Default is NIFTY50.
Relative Strength Auto ComparisonRelative Strength Comparison with automatic selection of relevant index
Added support for most european and north american exchanges.
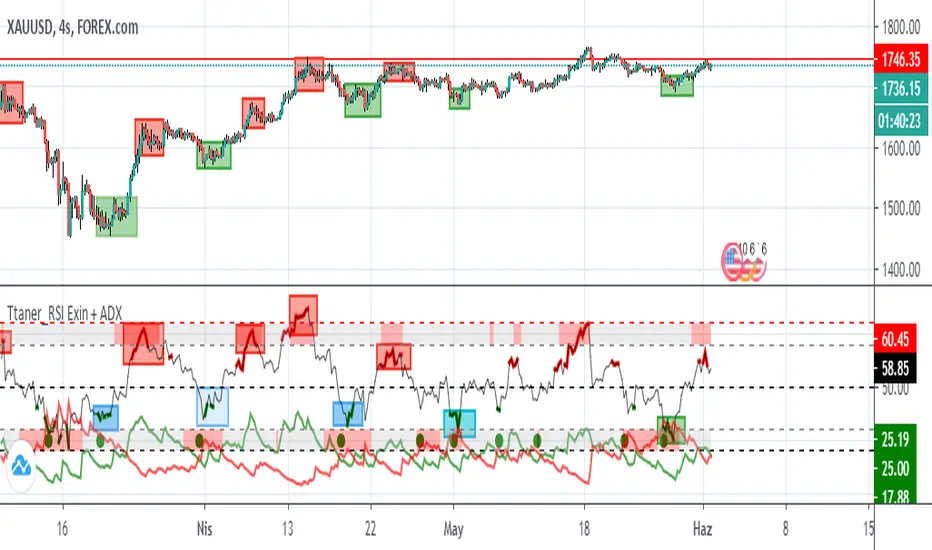
Relative Strength Index Exin + ADX Hello friends, I wish you all the best.
Relative Strength İndex + Adx coding.
I'd like to talk a little bit about how it works
We can say that the ascension action begins when the green line rises above the red line
you can measure the success rate of this indicator from the past.
RSI The green dots at the bottom show reception.
RSI The red dots on the top indicate that sales may come.
RSI means purchase when the bottom is green
When the RSI top line turns red, it means sales
If my sharing has helped you, you can like and support it. Stay tuned to be notified of new analysis and indicators
Relative Strength with NIFTYThis script checks the relative strength of a security with respect to NIFTY

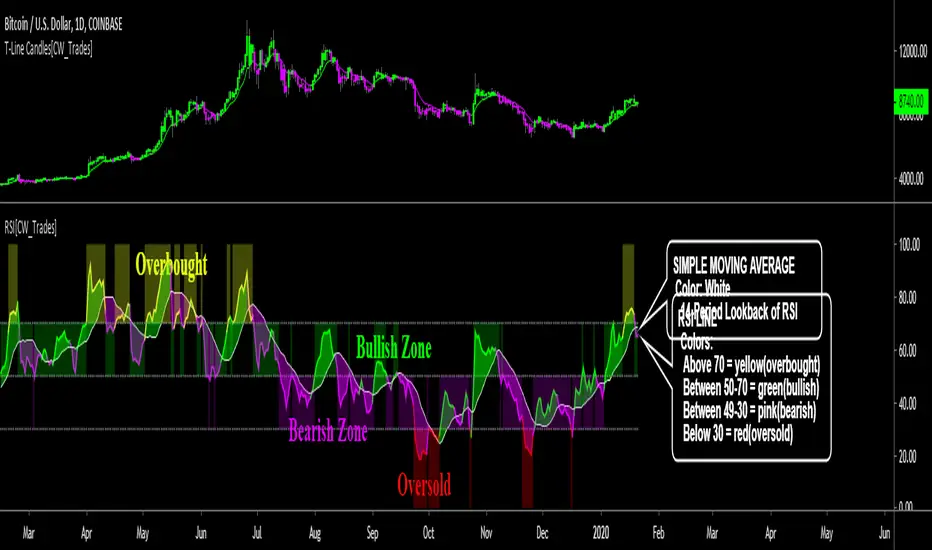
Relative Strength IndexThe relative strength index (RSI) is a momentum indicator that measures the magnitude of recent price changes to evaluate overbought or oversold conditions in the price of a stock or other asset. The RSI is displayed as an oscillator (a line graph that moves between two extremes) and can have a reading from 0 to 100. The indicator was originally developed by J. Welles Wilder Jr. and introduced in his seminal 1978 book, New Concepts in Technical Trading Systems.
Traditional interpretation and usage of the RSI are that values of 70 or above indicate that a security is becoming overbought or overvalued and may be primed for a trend reversal or corrective pullback in price. An RSI reading of 30 or below indicates an oversold or undervalued condition...more here .
-------------------------
*This indicator uses standard RSI settings of a 14-period lookback with a midline of 50, overbought level of 70 and oversold level of 30.
This RSI indicator has been modified to include a simple moving average of the RSI, adjustable overbought and oversold horizontal lines, a color-changing RSI line, color-filled RSI horizontal levels and color-filling the space between the RSI and simple moving average.
-This simple moving average(SMA) is set to a lookback period of 14 and is plotted as a white line. As the RSI moves above and below the SMA the color of the RSI changes; when above the SMA the RSI is lime, when below he SMA the RSI is pink. Lime indicates bullish momentum for RSI, pink indicates bearish momentum for RSI.
-When the RSI line is above 70 the RSI and background both turn yellow, this indicates overbought conditions.
-When the RSI line is below 30 the RSI and background both turn red, this indicates oversold conditions.
-The backgrounds fill the levels the RSI is trading between and can be turned on/off.
-The space between the RSI and SMA is filled and can be turned on/off.
-The RSI line can be set to solid or multi-color.
-The horizontal lines can be adjusted and turned on/off.
-The SMA can be adjusted.
For crypto or volatile markets, overbought and oversold levels of 80 and 20 are recommended.
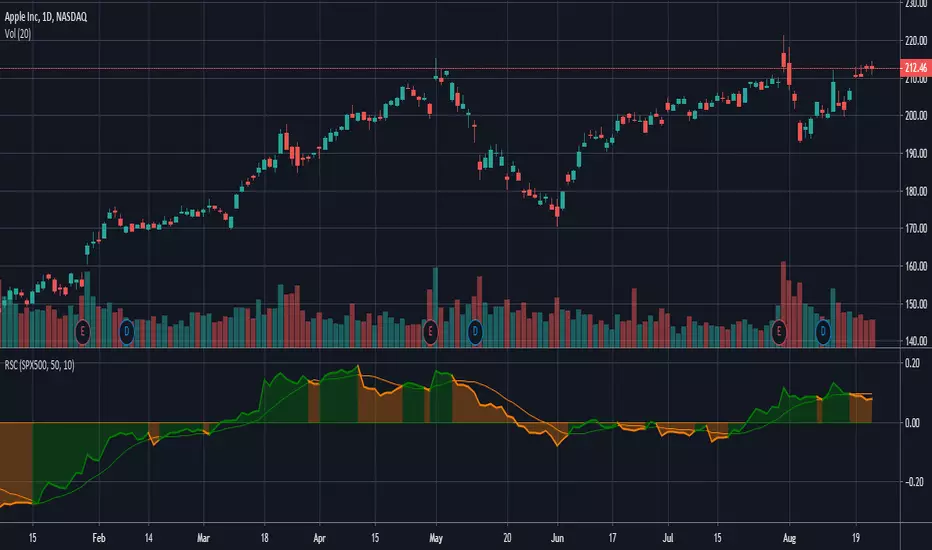
Relative Strength Comparison (RSC) Indicator SignalsThis Relative Strength Comparison (RSC) indicator overlays a simple moving average (SMA) of the prior days values and changes color when the RSC crosses above and below that value as an indicator with bearish and bullish signals in comparison to another symbol.
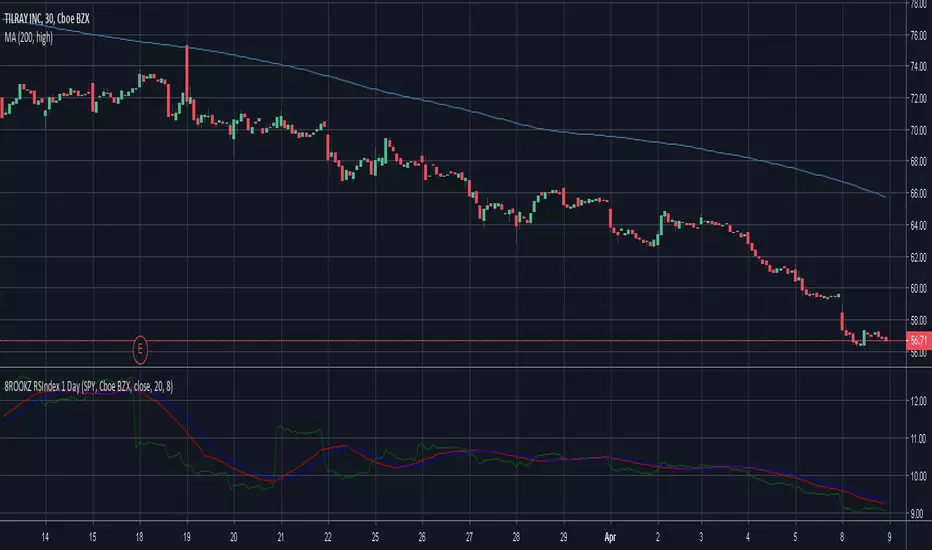
8ROOKZ Rel Strength to index - 1 DayRelative Strength to Index
- use to understand the correlation between stock and the index
- Calculated on one day close
Relative Strength (MA) to KLCICompares a stock's relative strength against Malaysia market index (KLCI)

Relative Strength Index - Divergences - Libertus Modified ALERT Hello, this is a script modification request from @emanuel.
It notifies you when a signal comes up and requests for your attention.
Please find the full usage of this script here if you would like to know other details
All credits go to @Libertus for the script

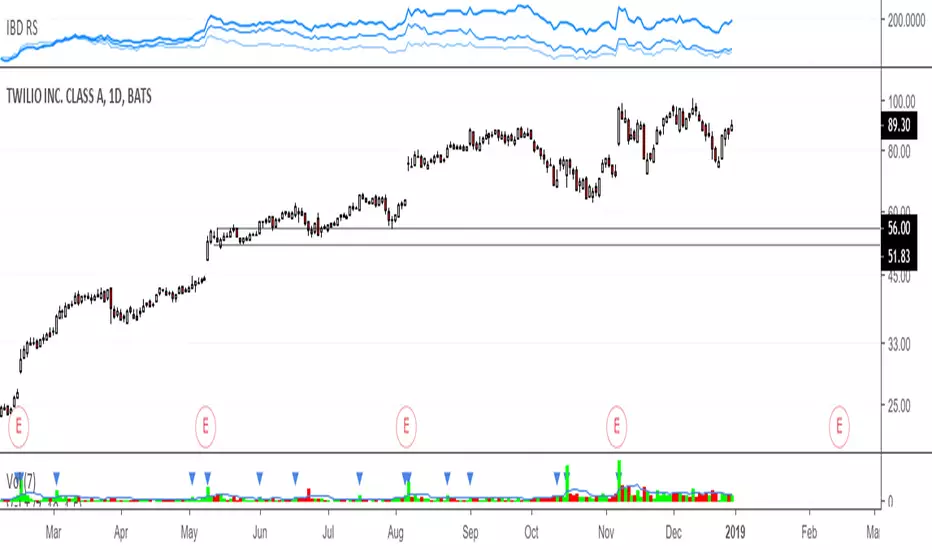
IBD RS, Relative strengthRelative Strength calculation of 3 time periods: 12 months, 6 months and 3 months.
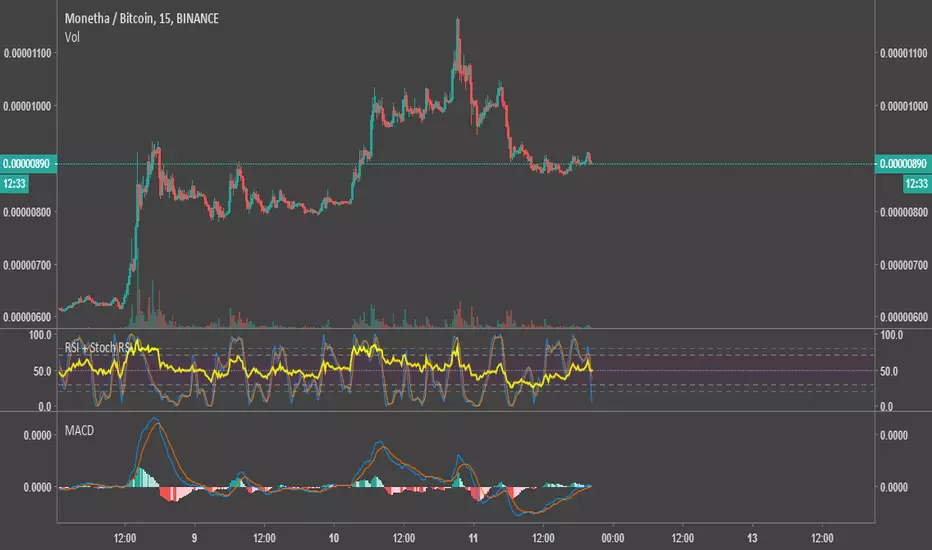
Relative Strength Index & Stochastic RSIThis script calculates both RSI (Relative Strength Index) and Stock (Stochastic) RSI Indicators, and plots them with a distinctive background on the same graph. The colors were chosen to be very easy on the eyes.
I published it as a way to give back to this community. Use your own judgement when trading, I am not responsible for any losses resulting from the use of my script.
Feel free to modify the script with no attribution.
Relative strength to NiftyThis will compare the Relative strength of the underlying stock to the Nifty index
